Loyalty

Discover insights that drive smarter decisions and higher customer value

Wallet analytics
Pinpoint competitor products capturing your customers’ dollars.
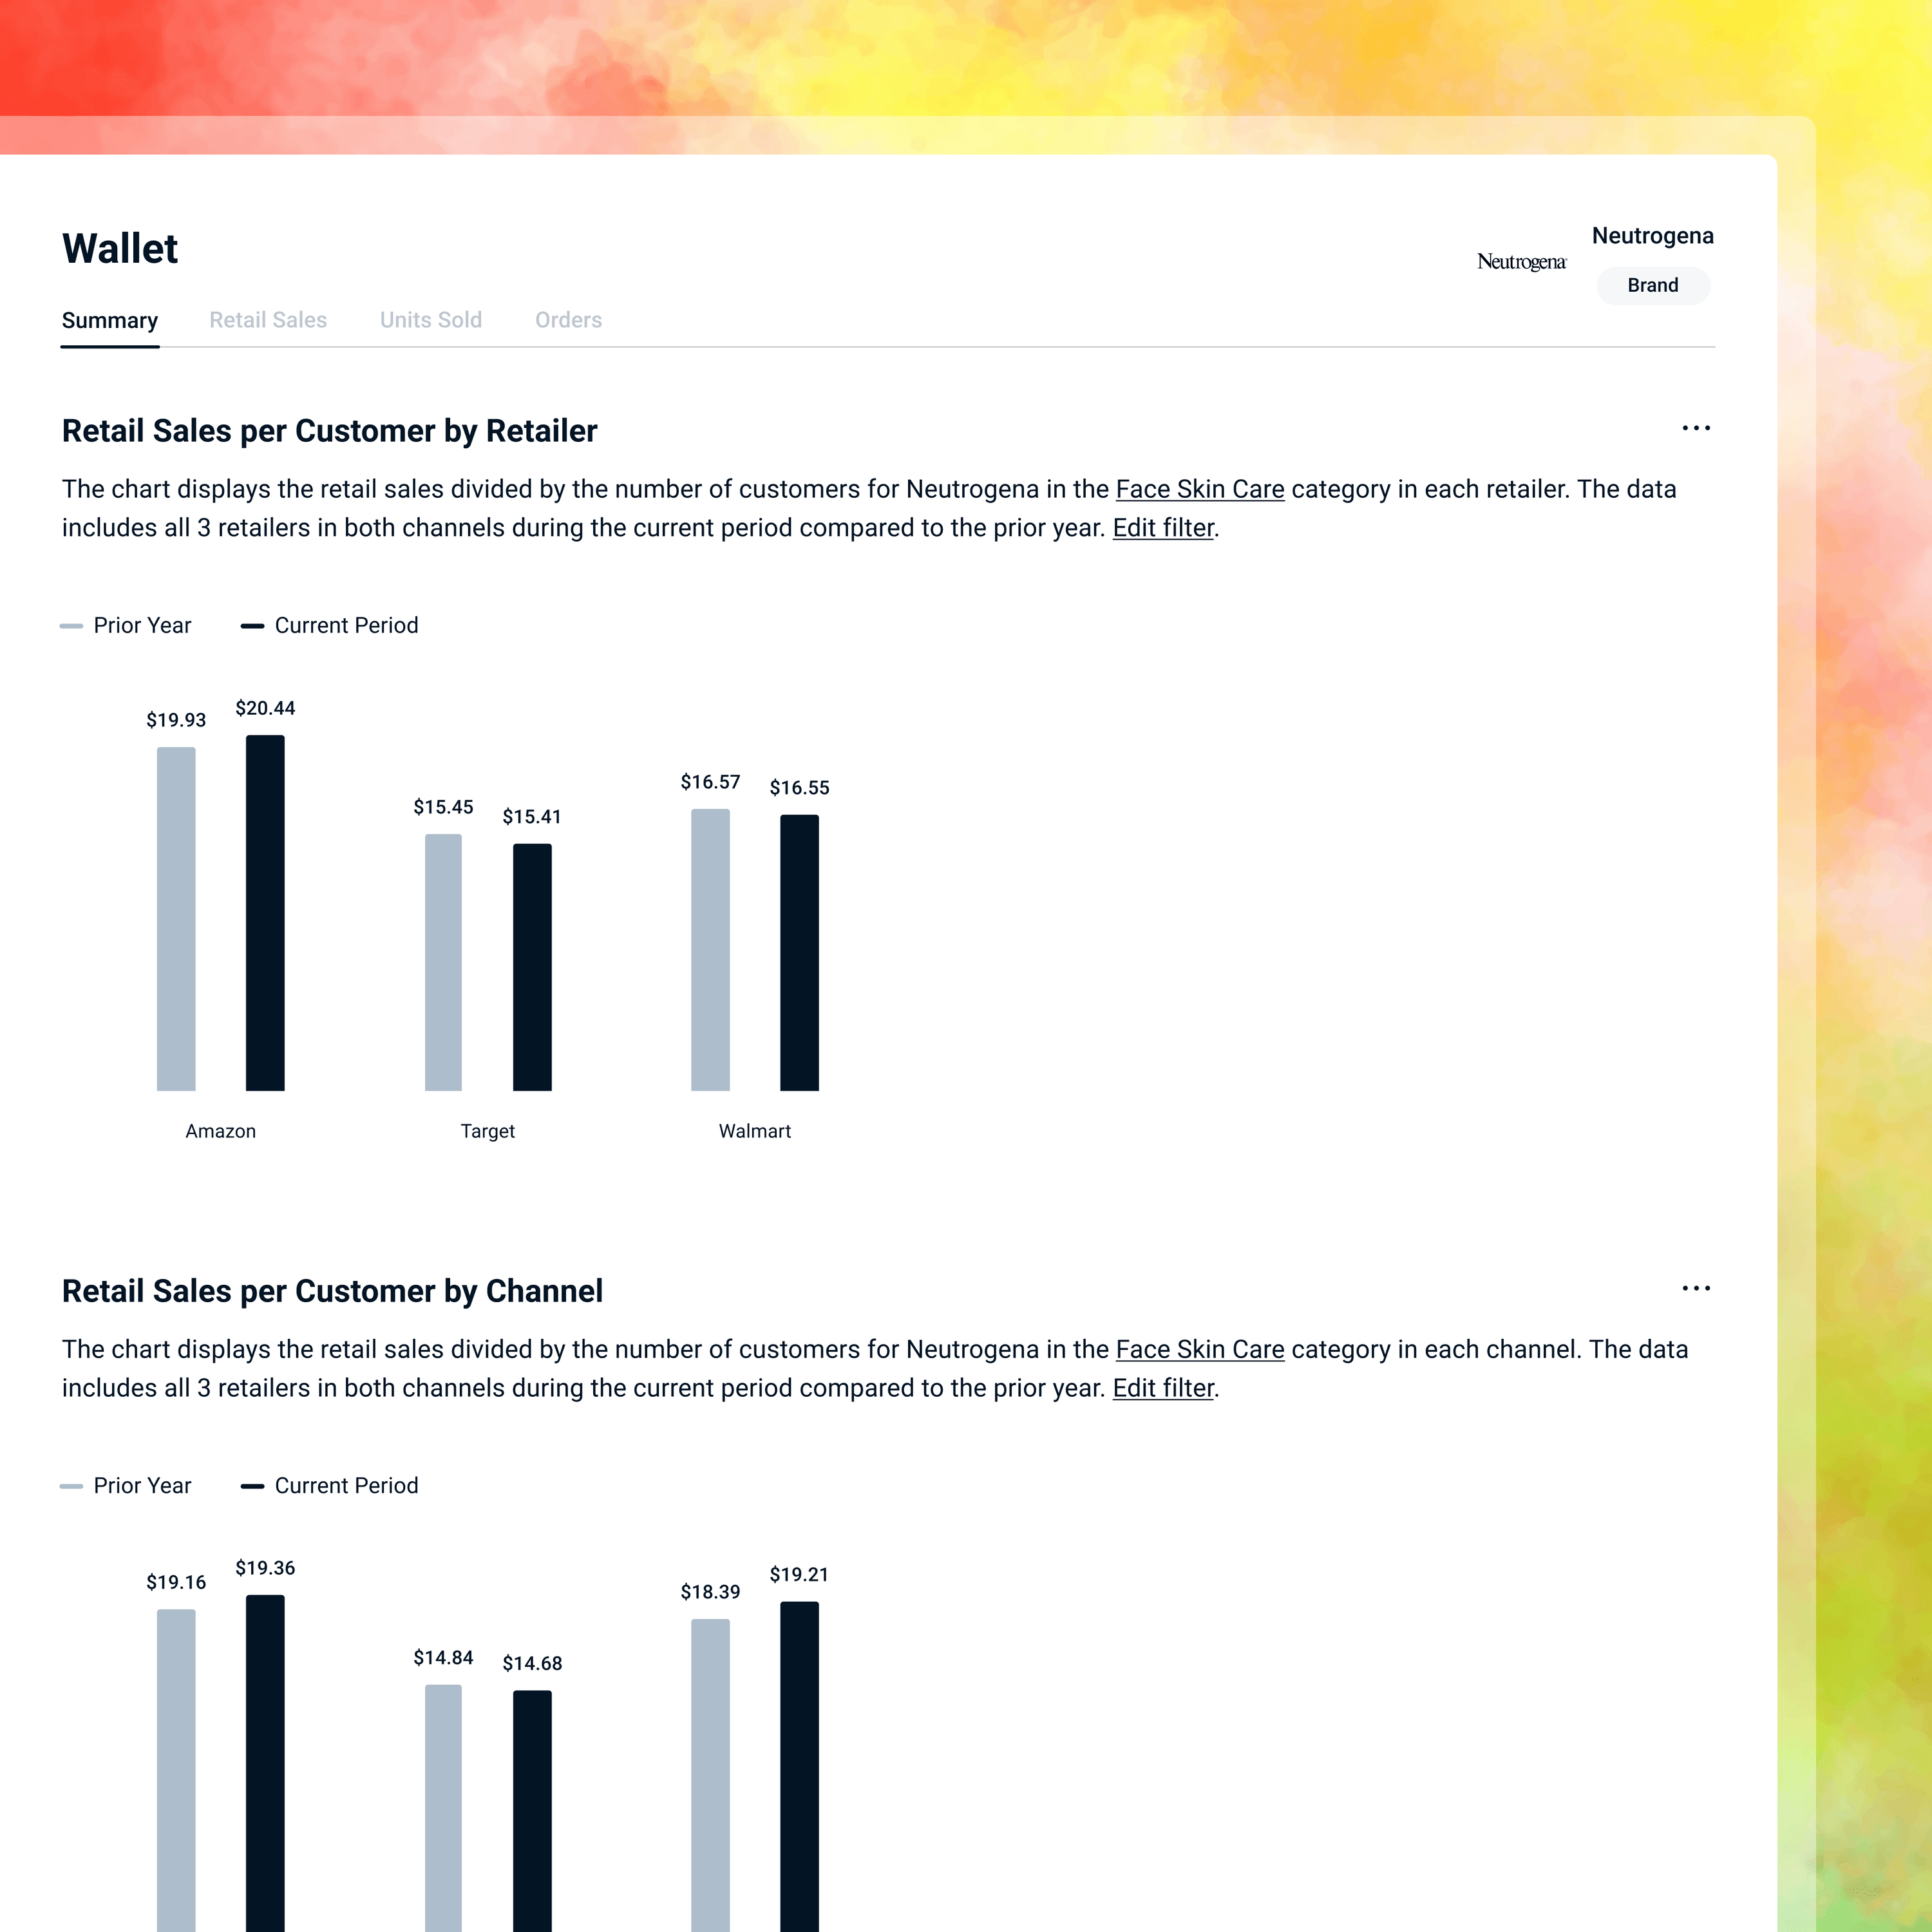
Understand precisely how your customers allocate their spending—and what it means for your brand’s growth.

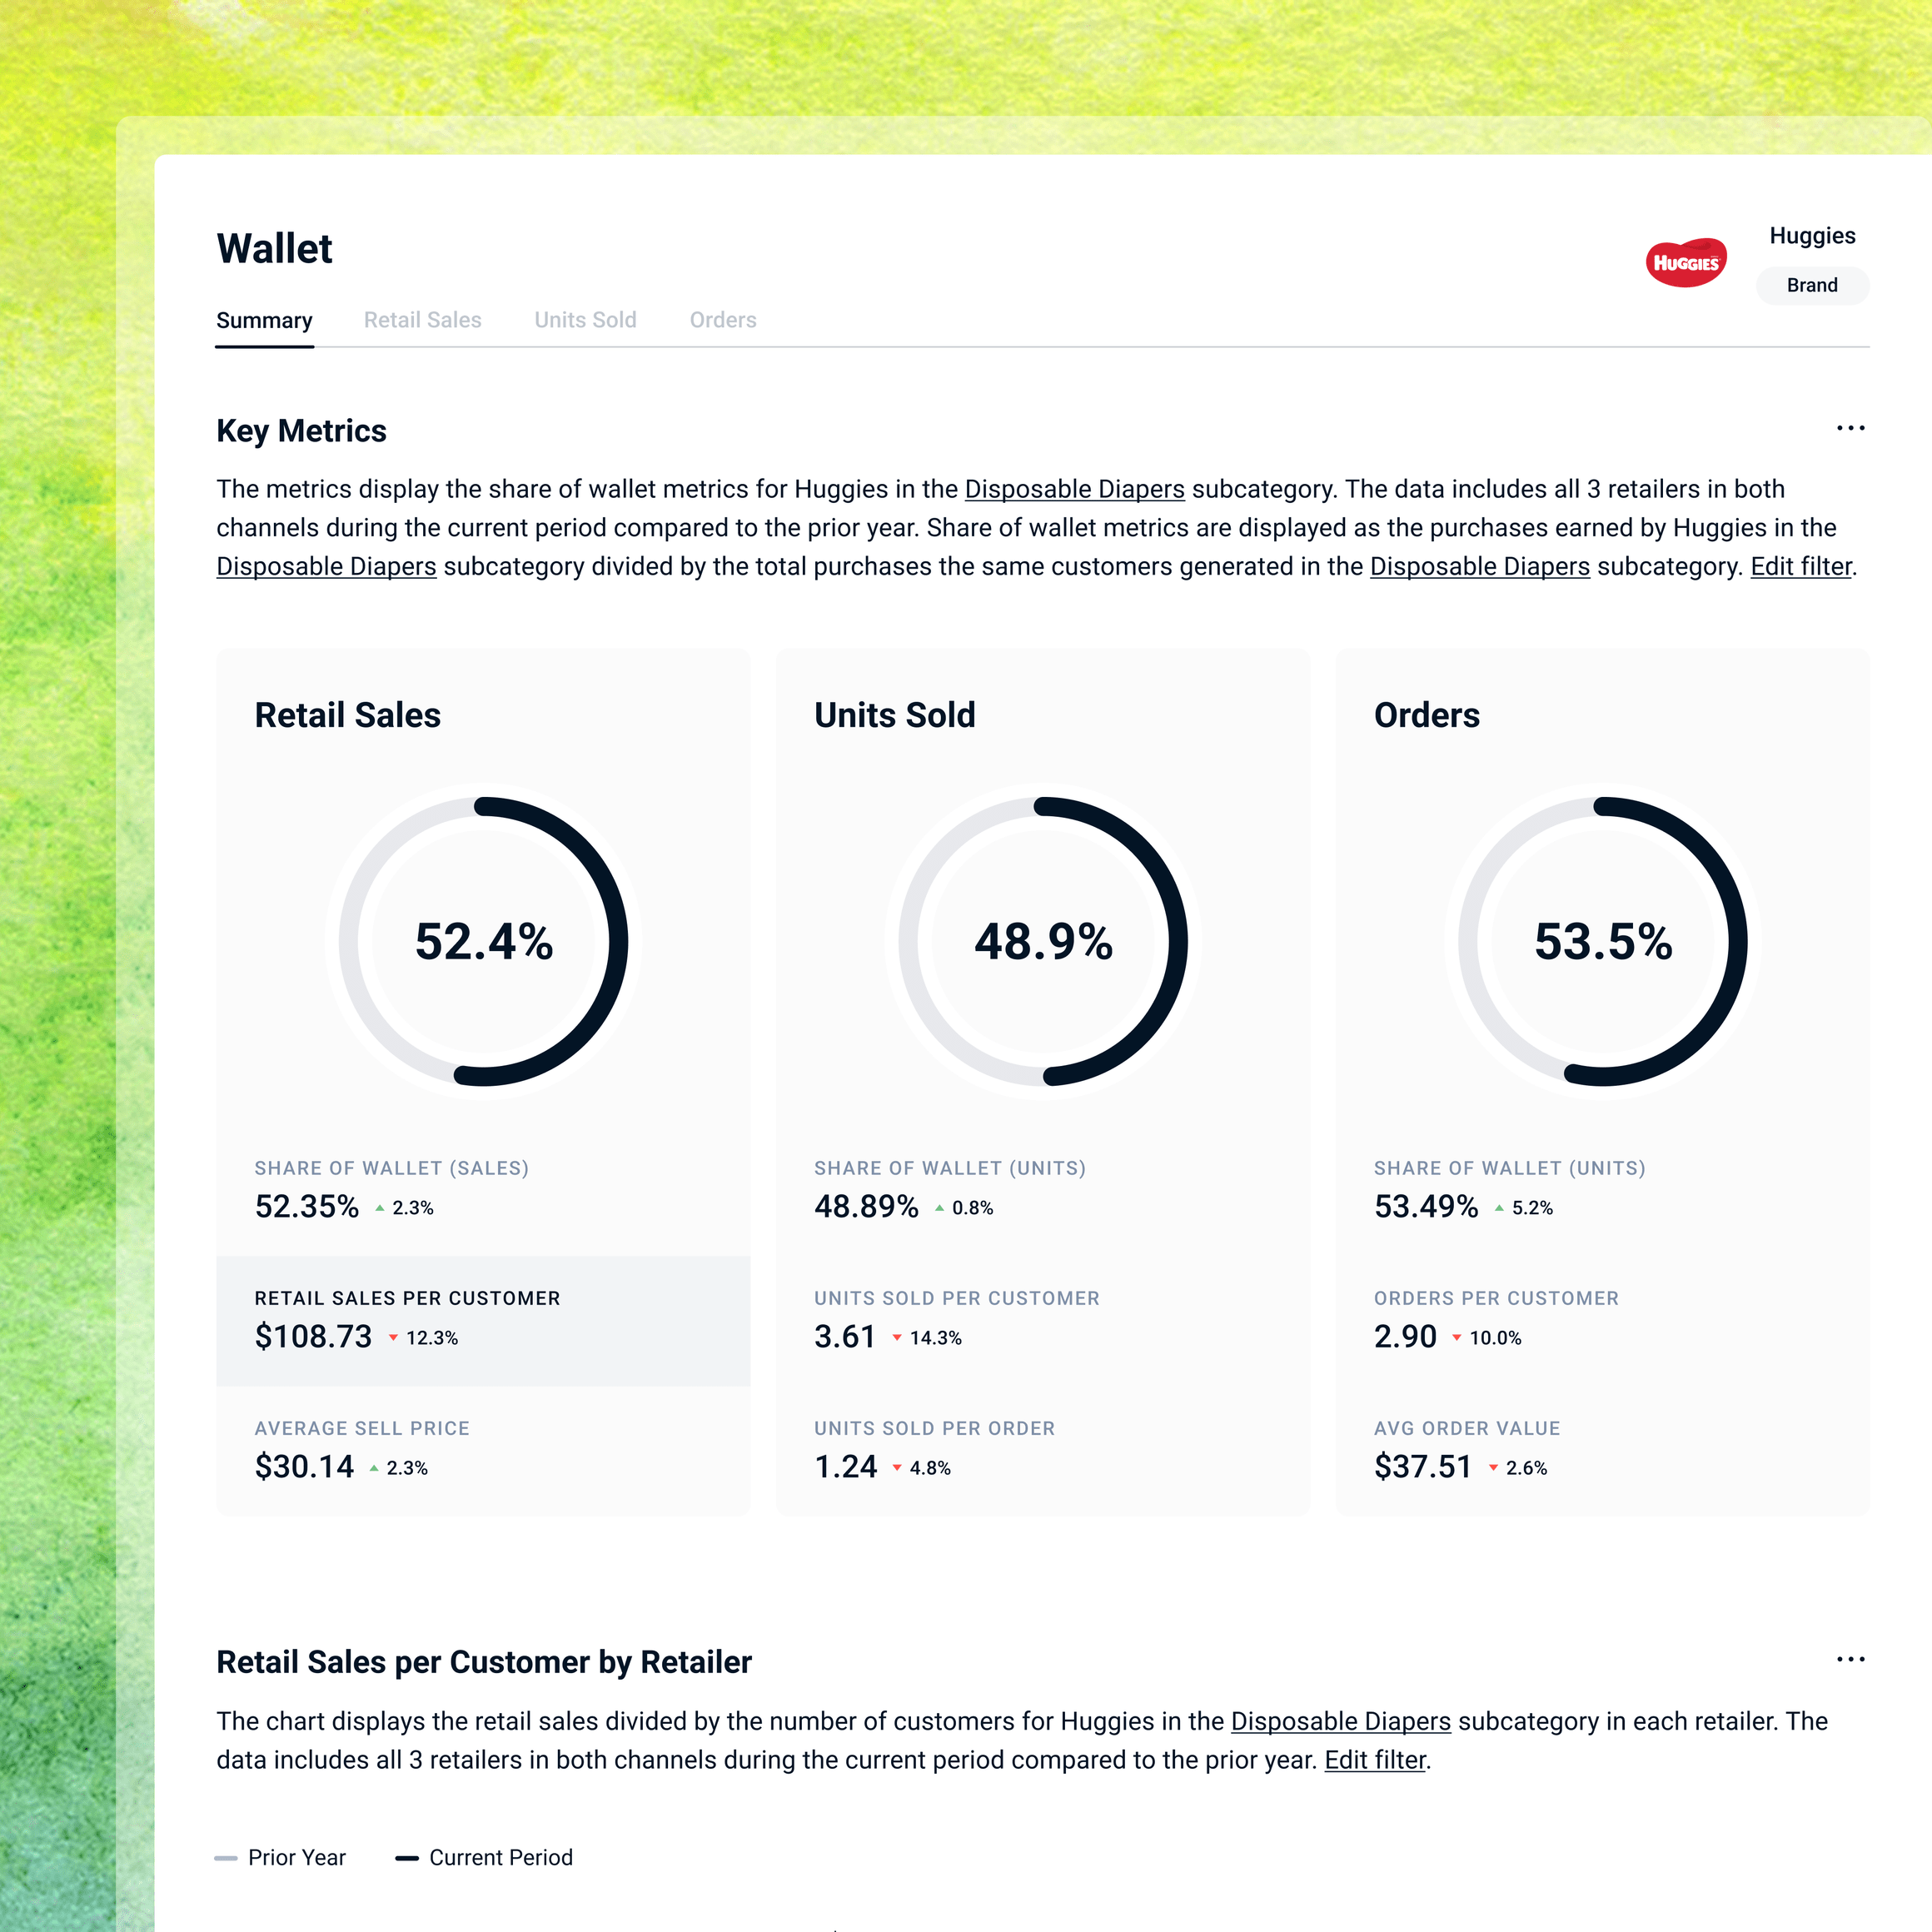
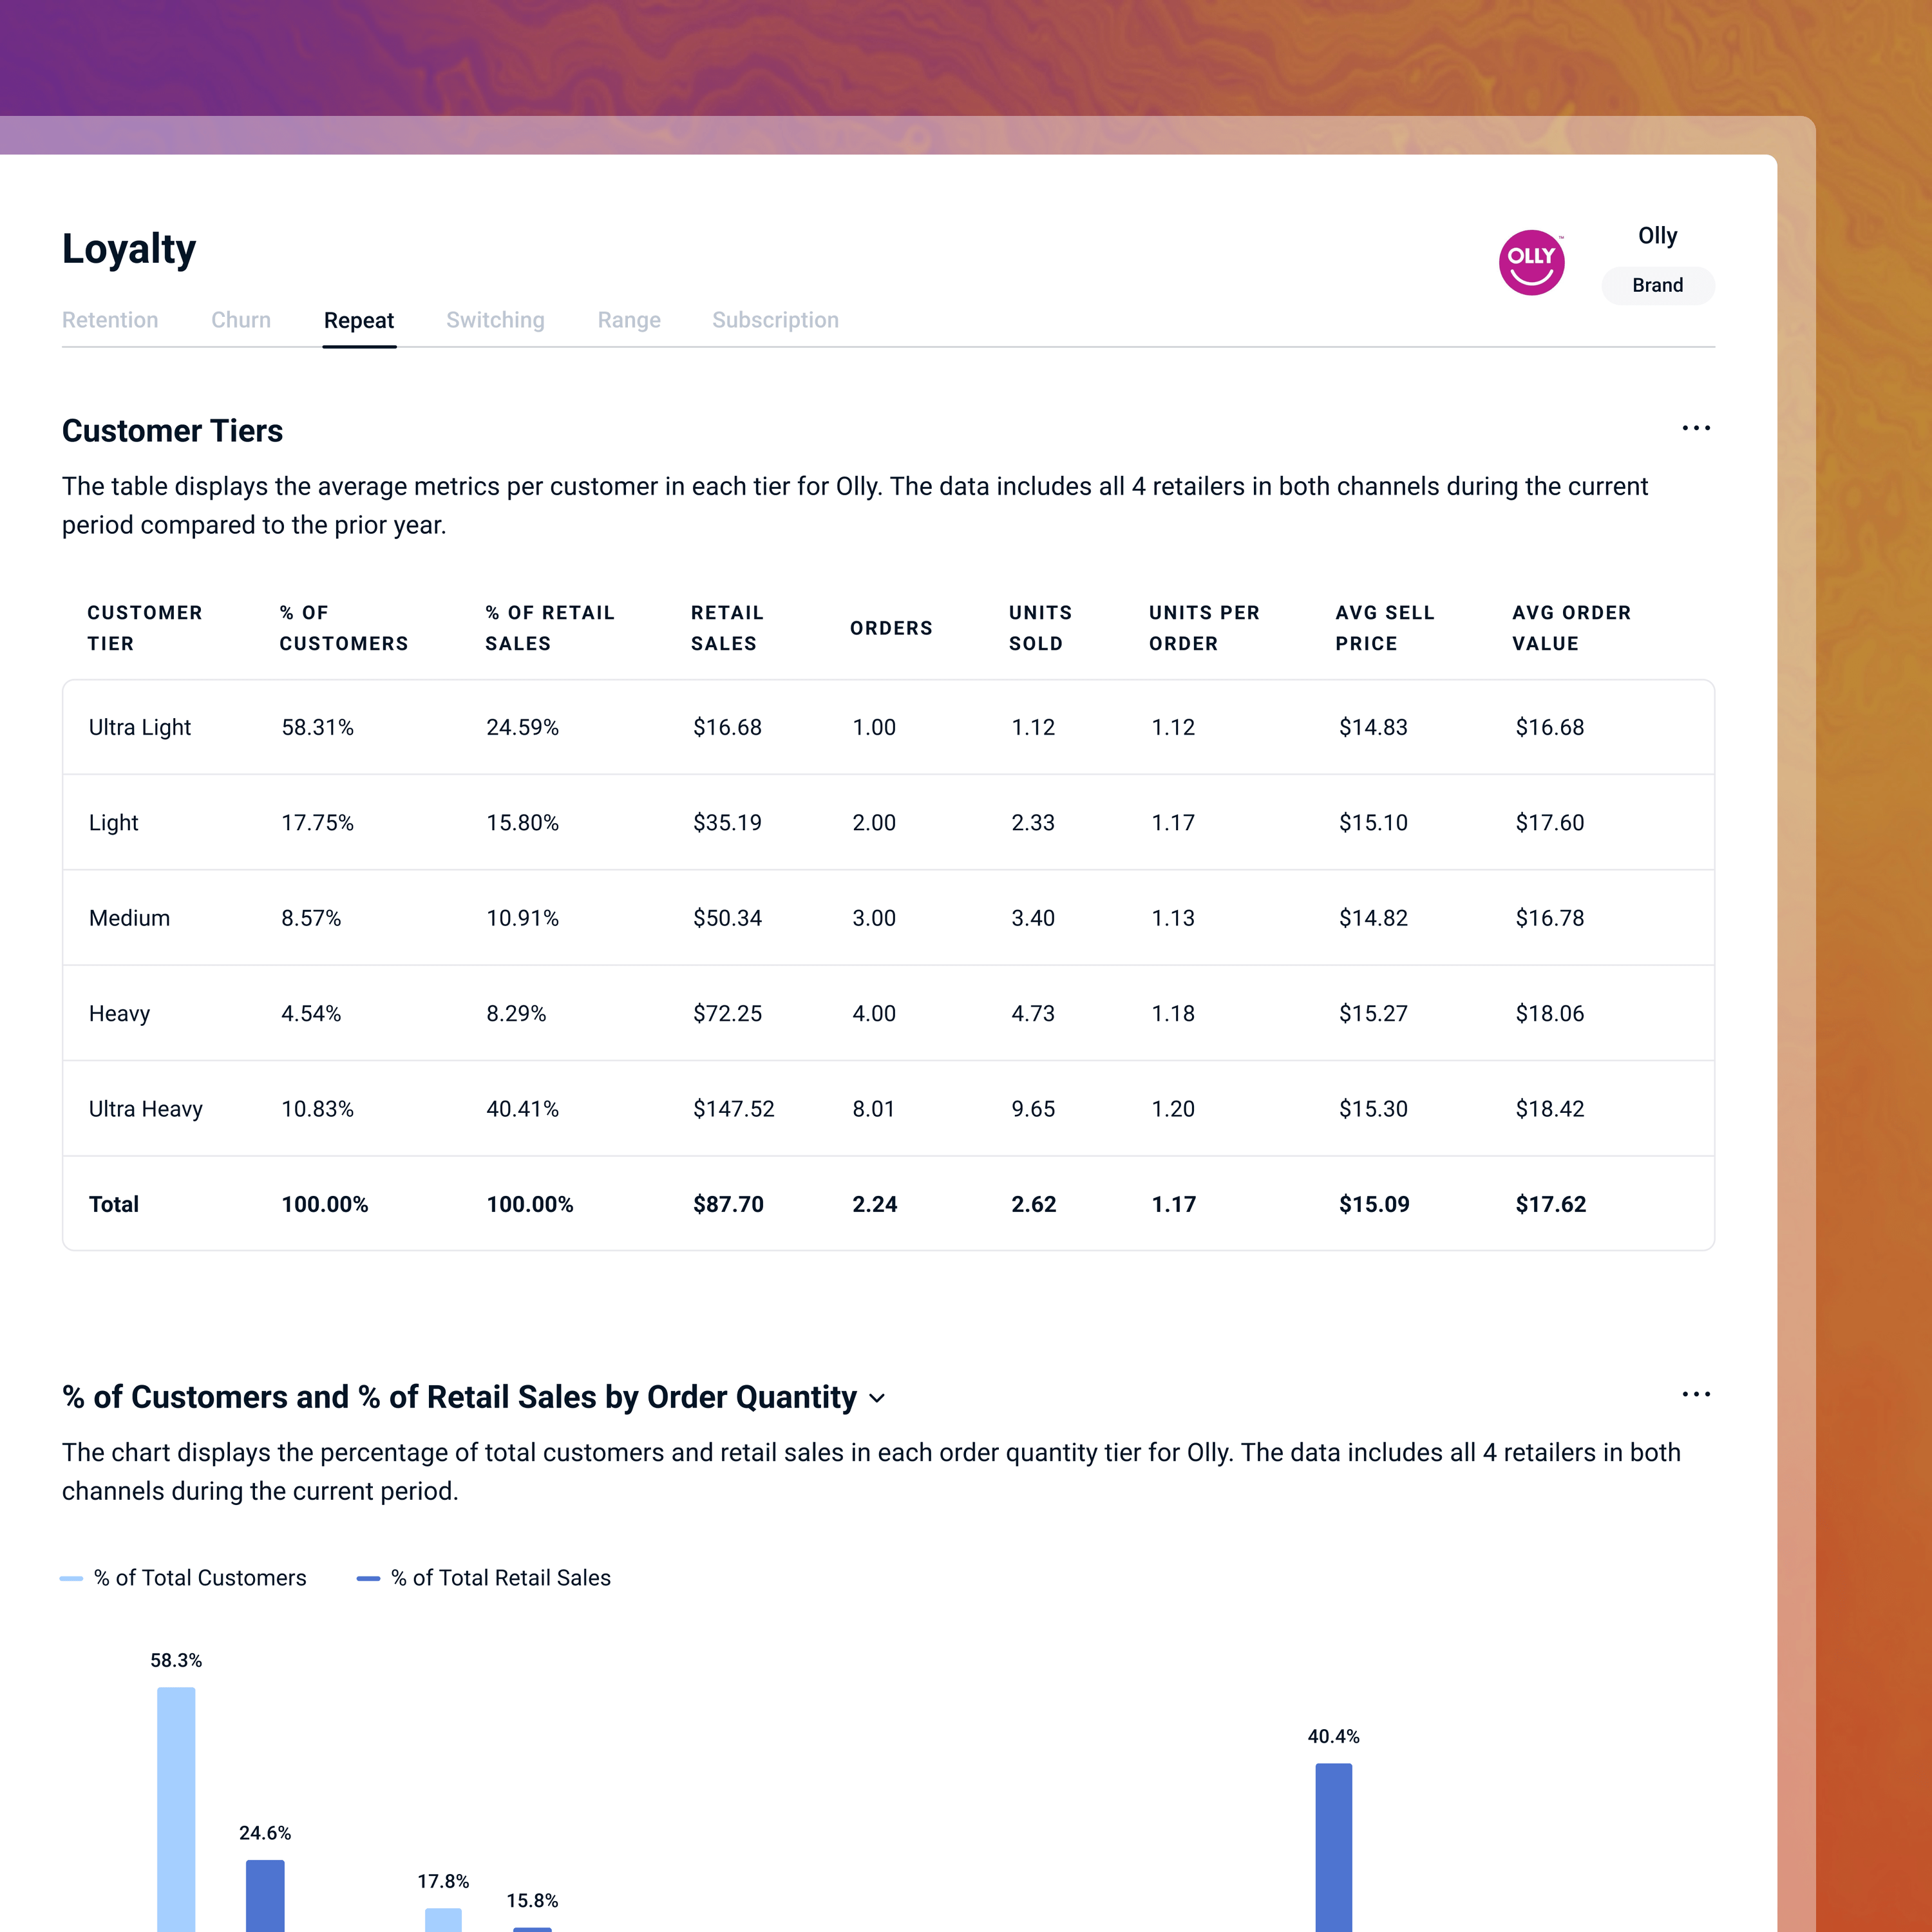
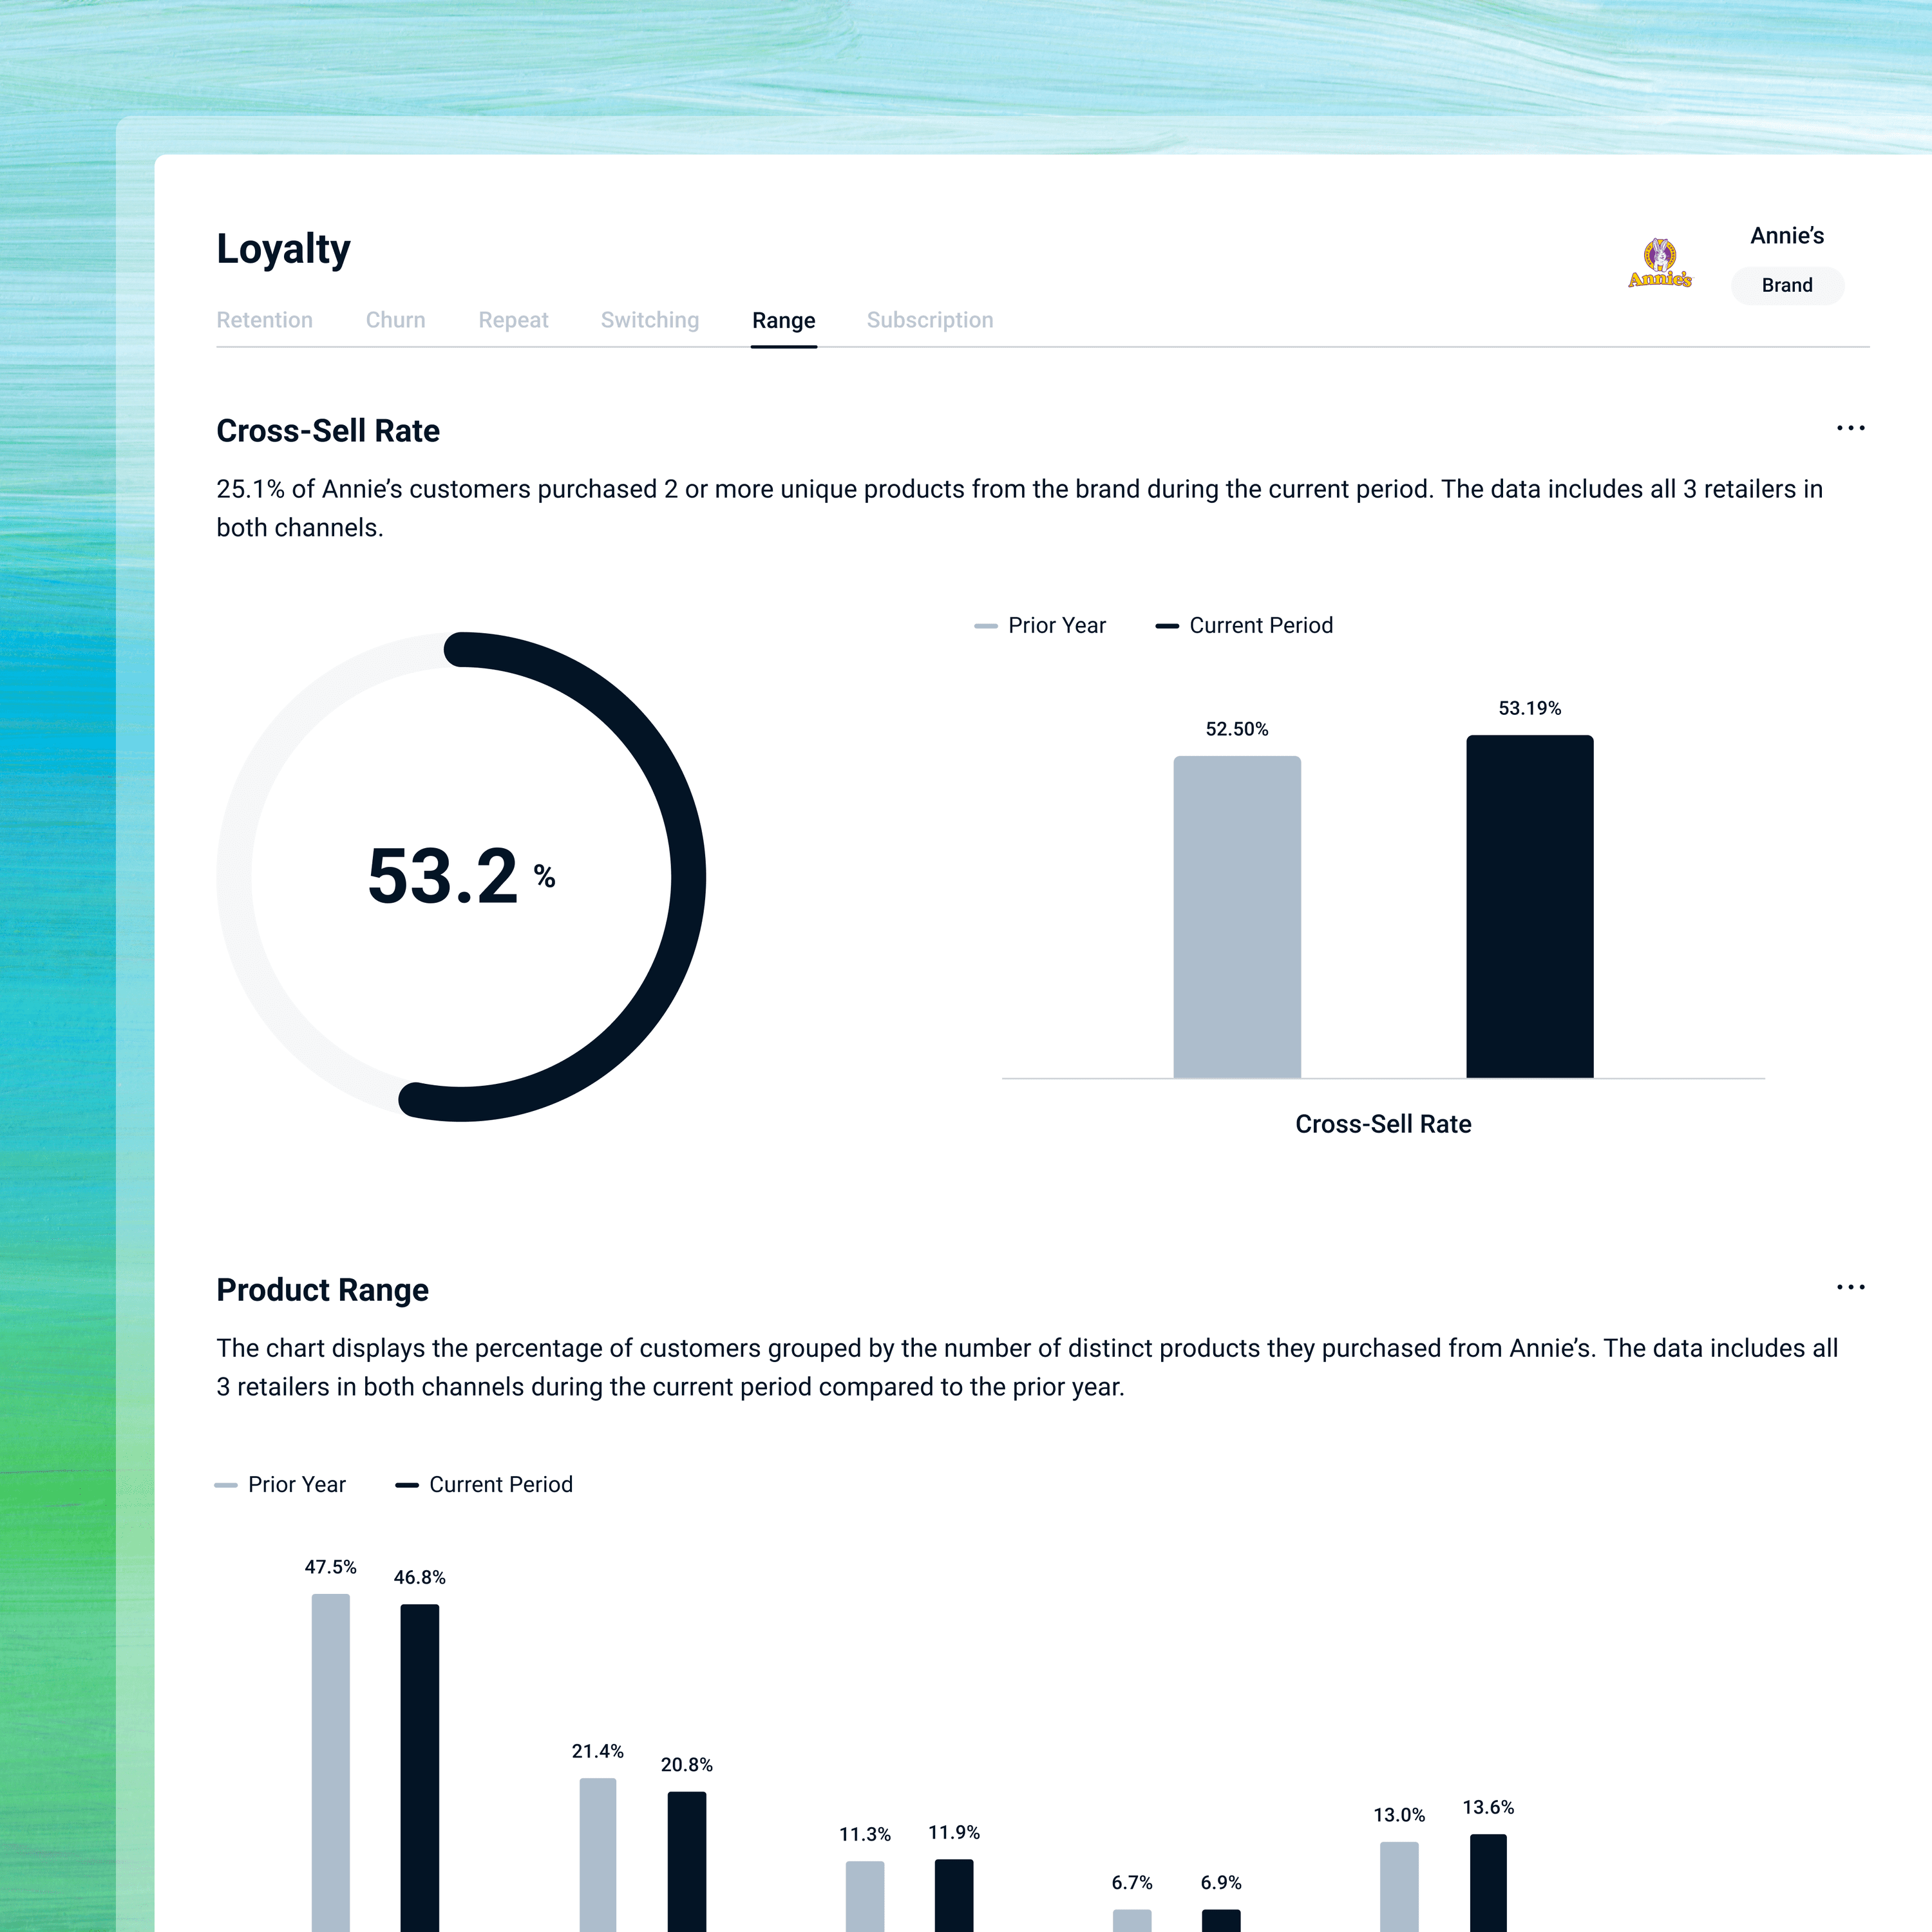
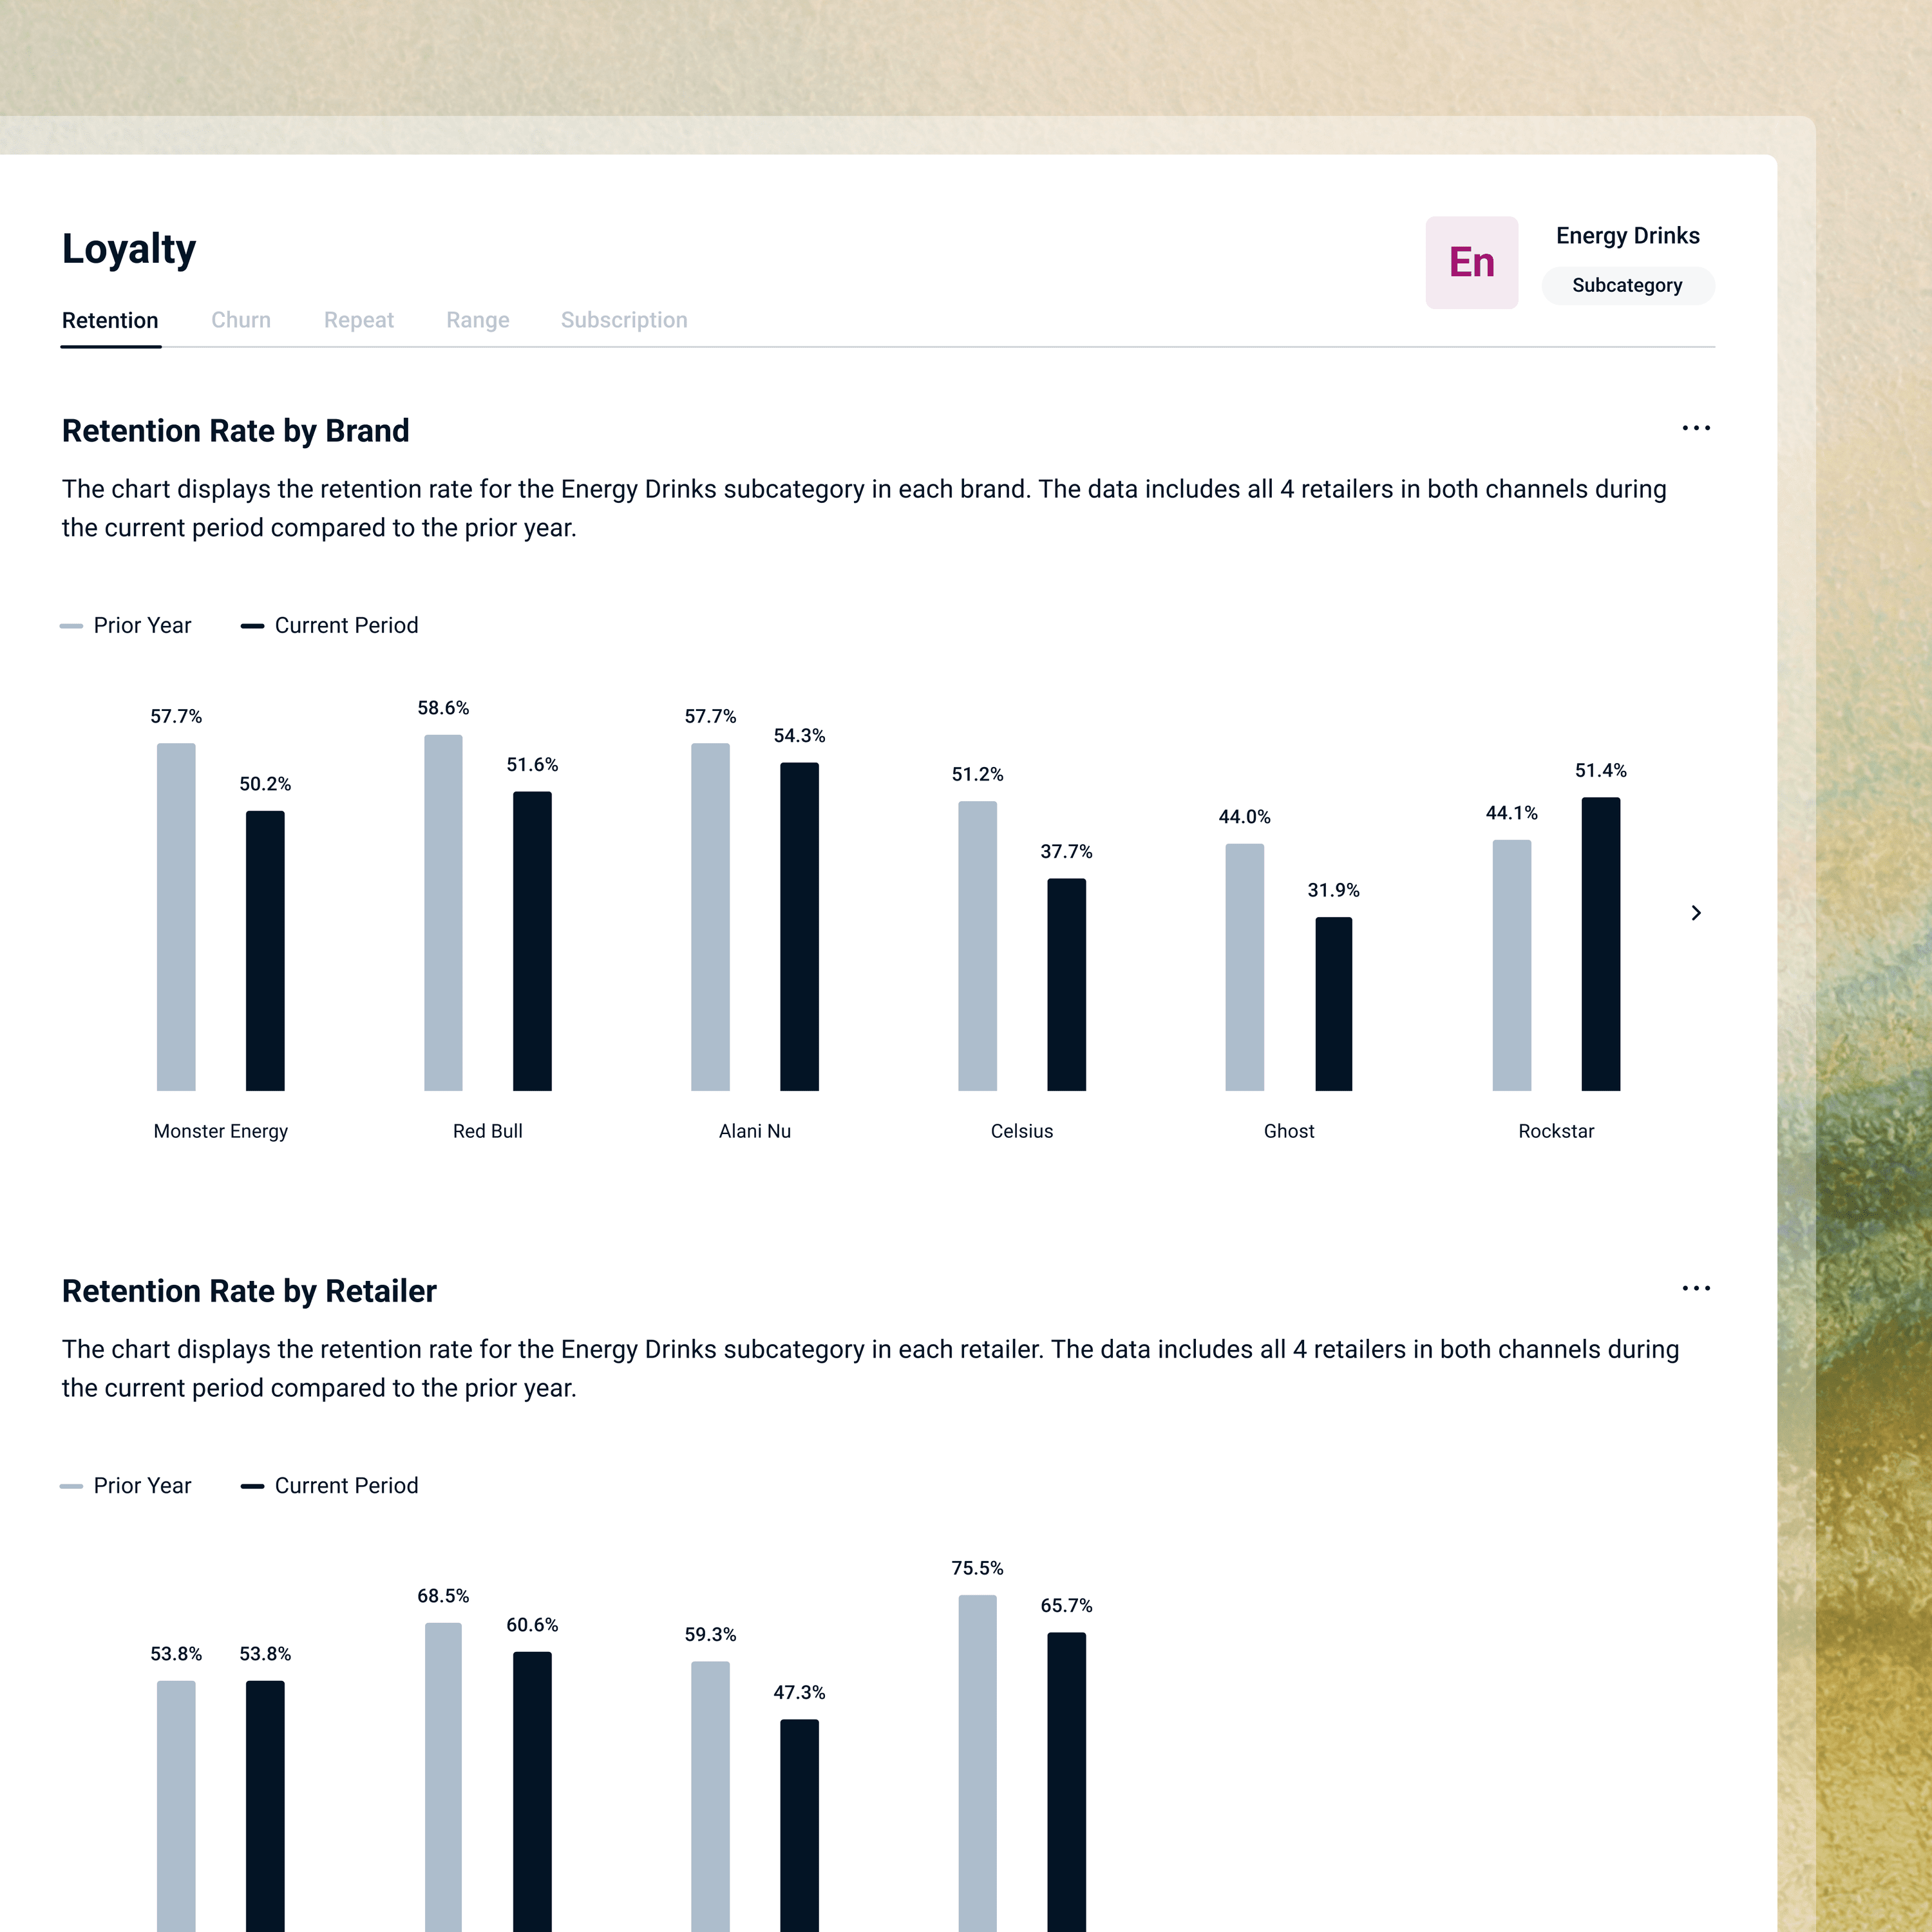
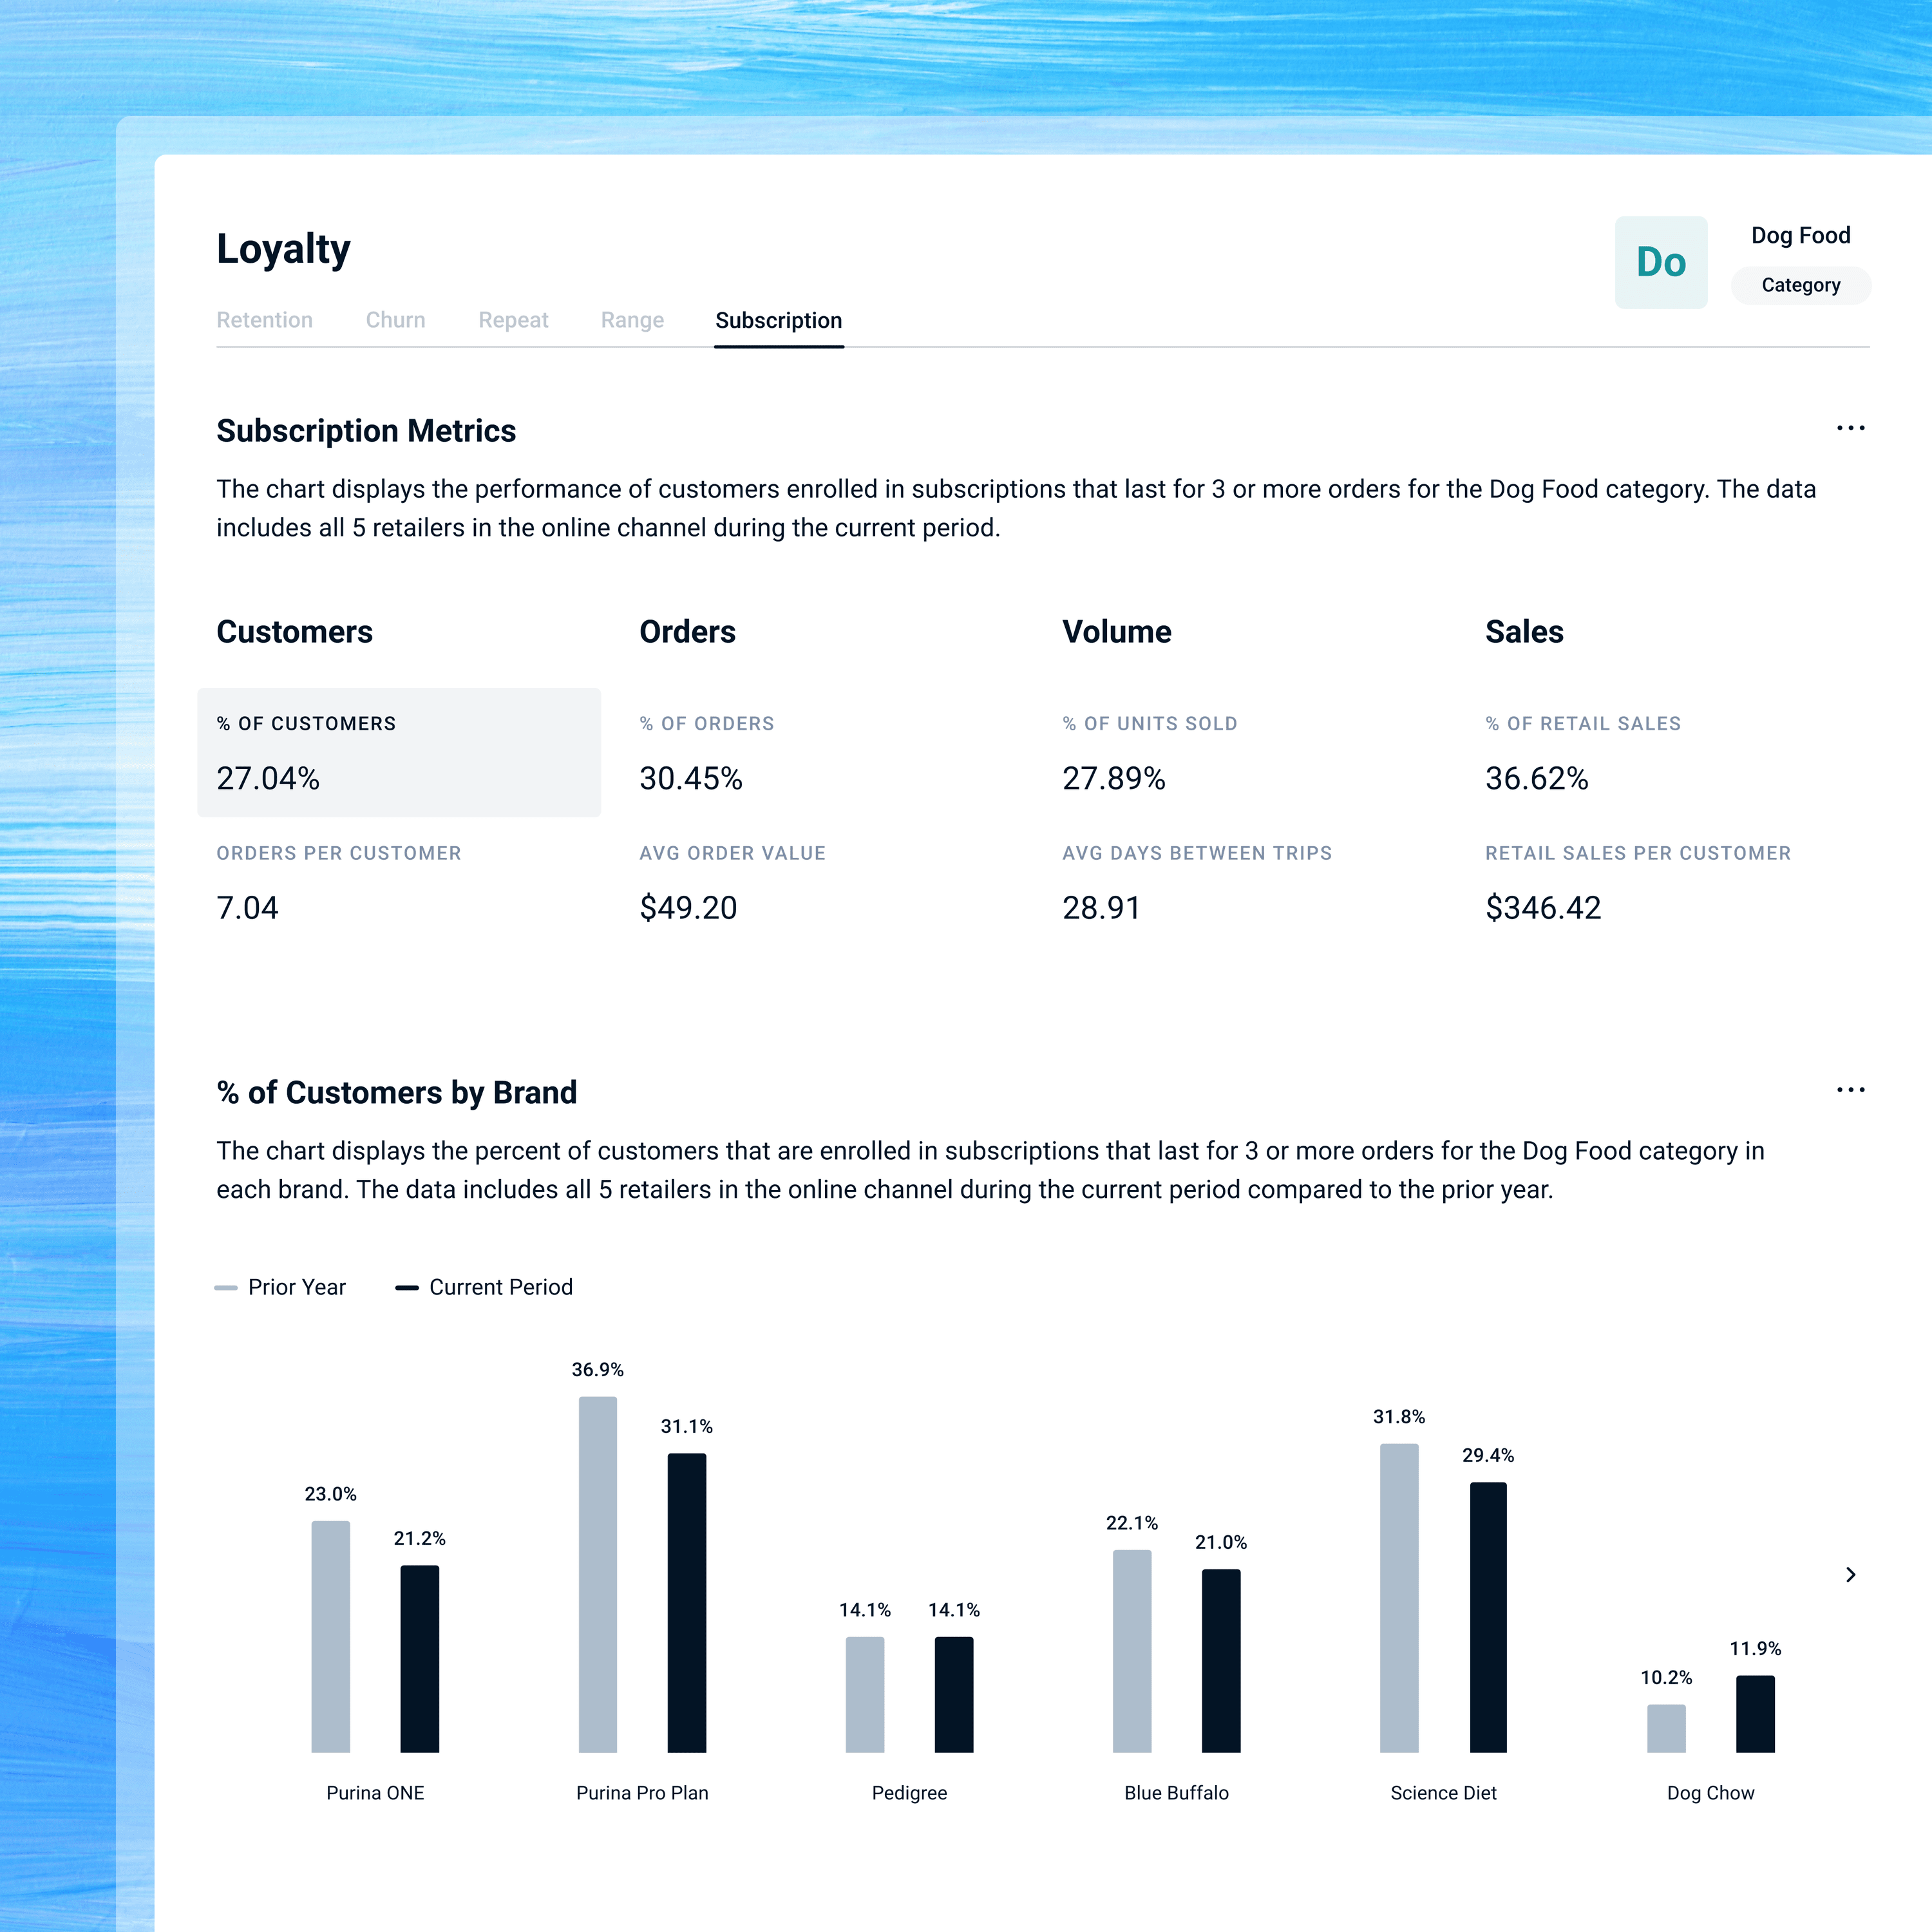
Our wallet analytics capability gives you an unmatched view into the products and competitors capturing share of wallet from your most valuable shoppers. Spanning millions of customers across Amazon, Walmart, Chewy, and many other omnichannel retailers, this dataset helps you see exactly where purchasing power goes beyond your own offerings.

With these insights, you can identify patterns that influence buying behavior, uncover gaps in your product portfolio, and develop strategies to win back spend. From informing new product development to refining ad targeting and promotional investments, wallet analytics turns raw data into a blueprint for driving sales and deeper loyalty.
Repeat and customer tiers
Identify your high-value customers and design campaigns that reach more people like them.
Get a clear picture of who your customers are and how often they choose your brand. Our repeat and customer tiers capability breaks down your audience into meaningful segments based on purchase frequency, so you can see exactly how each group contributes to sales and profitability across Amazon, Walmart, Chewy, and other leading retailers.

From one-time buyers to your most loyal shoppers who purchase five or more times, you’ll gain the clarity to understand the true drivers of growth.

Dive into the specific audience types that represent your most valuable shoppers and activate strategies to acquire more customers like them.
Cross-sell analytics
Uncover the patterns that drive multi-product loyalty.
See exactly how your customers expand their relationship with your brand over time. Our cross-sell analytics feature provides a clear, data-driven view into how shoppers engage with your complete product range across Amazon, Walmart, Chewy, and other major retailers. Instantly identify which customer segments naturally purchase multiple categories, and which remain loyal to a single SKU.

Benchmark your cross-sell and upsell performance against any competitor to see where you outperform the market—and where you have opportunities to grow. By understanding how different cohorts evolve from first purchase to multi-product engagement, you can tailor marketing, promotions, and product launches to encourage deeper connections.

With these insights, your teams can design targeted campaigns that motivate customers to try new items, increase repeat visits, and strengthen loyalty.
Retention analytics
Understand why customers stay, leave, or switch to other brands.
Gain an unprecedented understanding of how your customers remain engaged with your brand across every channel and retailer.

The retention analytics data set delivers a panoramic view that goes far beyond basic metrics. You can track which shoppers continue to buy from you, which lapse over time, and which migrate to competitive brands. This holistic perspective uncovers valuable insights into the real drivers of loyalty and churn since it captures data on every shopper over a five year time horizon across all major retailers.

By analyzing year-over-year retention and churn trends, you’ll see exactly how your performance stacks up against competitors.

Armed with this intelligence, you can build targeted messaging, marketing, and advertising campaigns that retarget shoppers at the right time to ensure you keep them coming back.
Subscription analytics
Benchmark and analyze the real impact of retailer subscription programs.
Discover what truly drives subscription loyalty and how it fuels your bottom line. Our subscription analytics capability sheds light on how your customers engage with programs like Amazon Subscribe & Save, Chewy Auto Ship, and other recurring order services across major retailers.

Instead of simply tracking initial sign-ups, this module highlights the customers who consistently renew, revealing the audiences that deliver stable, repeatable revenue.

You’ll be able to compare your subscription adoption and retention rates against competitors and measure how these programs impact lifetime value, purchase frequency, and profitability. The platform also surfaces detailed trends over time, helping you understand which segments are most committed to ongoing purchasing.

With these insights, your teams can prioritize investments that nurture long-term loyalty and allocate resources toward strategies proven to keep subscribers engaged.
Lifetime value analytics
See which customers deliver the greatest lifetime value over time.
Understand exactly which customers create long-term impact for your brand.

Our lifetime value analytics capability empowers you to measure customer value across every major channel and retailer, from Amazon to in-store purchases. You’ll see how LTV varies by demographic segments, purchase cohorts, and shopping behaviors, giving you a nuanced view of what drives sustained revenue.

Compare your performance against competitors to benchmark progress and identify untapped opportunities to increase profitability. Whether you’re analyzing first-time buyers or your most loyal customers, these insights make it clear where to invest your resources for maximum return.

By aligning advertising, promotions, and retention efforts with the retailers and audience types proven to deliver high lifetime value, your teams can design strategies that grow revenue more profitably.
Brand equity research
Measure brand equity and see how you stack up against competitors.
Your brand is built on perception, emotion, and experience—and understanding those dimensions is essential to stay ahead. Our brand equity research solution empowers you to collect feedback directly from the audiences that shape your success. Whether you want to gauge emotional connection, assess purchase motivators, or understand how your brand compares to competitors, you’ll have the tools to uncover the full picture of brand health.

Target highly specific customer segments across Amazon, Home Depot, Chewy, and other retailers to get accurate insights that reflect real shopping behavior. Monitor changes in sentiment over time, spot early warning signs of declining equity, and track how your campaigns impact brand relevance.
Satisfaction research
Measure satisfaction by segment to uncover hidden performance gaps.
Your success hinges on how well you understand and respond to customer sentiment.

Our satisfaction research module equips you to measure precisely how shoppers feel about your products and brand across every channel. From net promoter scores to detailed CSAT metrics, you’ll have the tools to capture authentic feedback that reveals where you shine and where expectations are unmet.

With advanced audience targeting, you can collect input from specific segments—from new customers on Amazon to loyal repeat buyers at Best Buy—so you always know which groups are thriving and which are at risk of churn. This level of granularity empowers your teams to prioritize improvements, refine messaging, and tailor experiences that resonate deeply.

Equipped with clear, actionable insights, you can build strategies that convert occasional purchasers into passionate brand advocates, foster retention, and stay ahead of evolving customer expectations.
“Stackline helped us take precise actions that delivered growth and gained market share.”
Matt Kelly
Vytalogy
“Stackline has elevated our performance and helped establish a true performance culture.”
Thomas Angelidis
Spin Master
“We found Stackline’s information to be important for shaping our strategic direction.”
Jeremiah McNeal
Schwaab
Schedule demo
Schedule demo
We get results
See how leading brands unlock growth with our loyalty insights.
87.9k
Tide shoppers analyzed for switching and retention insights
Nehemiah used Stackline's multi-retailer sales analytics tools to understand shoppers, refine messaging, and drive Walmart engagement.
23%
Increase in shopper switch-ins from a competitor
Vytalogy used Stackline to unify analytics across Amazon, Walmart, and Target and monitor ingredient trends - driving a 10% consumption lift and 23% more switch-ins.
24%
Increase in total traffic during a challenging economic year
LIXIL drove 24% more traffic and saw an 8.11% incremental sales lift powered by AMC and Stackline, which mapped the full shopper journey and made data-driven budgeting decisions.
Get started
Talk to one of our experts
Schedule demo
Schedule demo